

Deal Analyser
A free UK property and business investment calculator — stress-test a deal before any money moves, and get an honest "no" when the numbers don't work.
What it is
A free calculator for UK property and business-acquisition deals. Five modes — buy-to-let, BRRR, HMO, business acquisition, and a reverse solver that works out the highest price a given funding structure can actually sustain. No login, no sign-up, no lead capture behind it.
Everything runs in your browser. Nothing you type is sent anywhere, and saved deals stay on your own machine.
Use it now
Reading about a calculator is a poor substitute for running a deal through one. The rest of this page explains how it is built and where it deliberately refuses to answer — but the fastest way to judge it is to put a real deal in and see whether the output tells you something useful.
The problem
Most property calculators give you a headline yield and stop. I wanted something that would tell me the truth about a deal, including the unflattering parts: what happens to the numbers under stress, what the deal actually costs to fund, what price it would have to be to work at all — and when a metric genuinely doesn’t apply, rather than quietly showing a misleading percentage.
What it analyses
| Mode | What it works out |
|---|---|
| Buy-to-let | Yield, cashflow, SDLT/LTT, stress test, cash-on-cash |
| BRRR | The above plus refinance economics — money taken out, cash left in, cash extracted, ROCE |
| HMO | Room-level income against the same cost and financing model, with ROI |
| Business acquisition | Full funding stack, debt service, DSCR, Debt/EBITDA, stress test, four-dimension risk analysis |
| Reverse deal | The highest purchase price that structure and those safety targets can sustain, and which constraint stops it going higher |
Stamp duty covers England/Northern Ireland and Wales, including the additional-property surcharge. Deals can be saved locally, reopened, compared side by side, exported as JSON or CSV, or printed.
Why some answers are deliberately N/A
This is the decision the whole tool is built around.
Run a BRRR where the refinance returns more than you put in and the standard return calculation quietly breaks. Return on capital is cash left in the deal as a percentage — so when cash left in goes negative, dividing by it flips the sign. An excellent outcome displays as a loss. The HMO side has the same failure through a different route: when funding covers more than the property cost, “buyer cash required” goes negative and ROI flips the other way, so a deal that is genuinely losing money can display a healthy positive return.
Deal Analyser floors the capital basis at zero, reports the excess as its own metric — Cash extracted on the BRRR side, Funding surplus on the HMO side — and shows N/A rather than a fabricated percentage. The same rule applies inside the stress panel: a scenario that pushes the denominator to zero reads N/A, not a bare 0.00% that looks like a real answer.
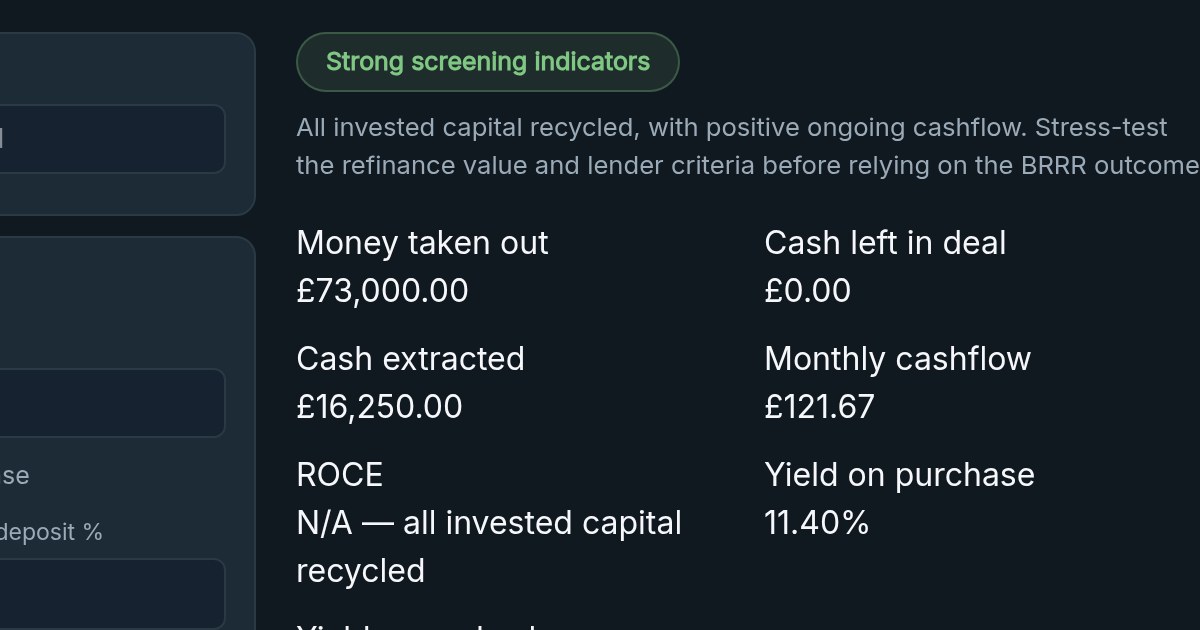
Illustrative inputs. The ROCE field is not empty because something failed — it is empty because no honest number exists there.
A tool that always gives you an answer is easier to trust than one that sometimes says the honest answer doesn’t exist. Only one of those is actually trustworthy. There is a longer write-up of this decision in Why a Property Calculator Should Sometimes Say “N/A”.
Reverse Deal answers a different question
A normal calculator answers “what does this deal return?” You supply a price; it scores it.
Reverse Deal answers something closer to “what would have to change for this to work?” You supply the business, your funding capacity and your safety targets, and it solves for the highest price those can sustain — then tells you which constraint is stopping it going higher. That last part is the useful bit. “Too expensive” is not actionable. “Funding capacity, and you are £150,000 short of the asking price” is.
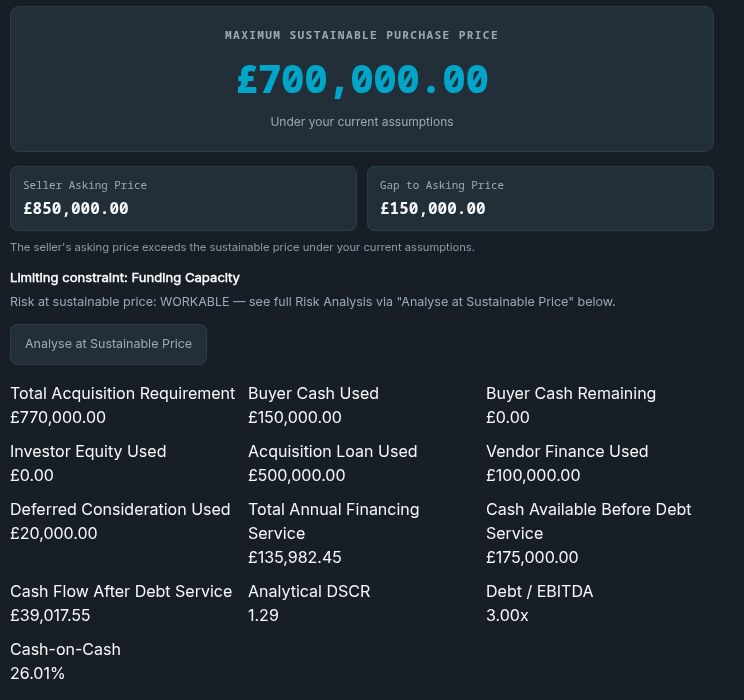
Illustrative sample inputs, run through the live tool. The seller wants £850,000; the structure sustains £700,000. The tool’s answer is “not at that price.”
It is deterministic — a binary search over candidate prices, not optimisation and not a model making a judgement. Every candidate price is turned into a full deal and evaluated through the same, unchanged forward calculator; the solver never reimplements a single formula. A fixed funding waterfall — buyer cash, then investor equity, then acquisition loan, then vendor finance, then deferred consideration, each capped and never forced to its cap — is what makes the pass/fail-in-price function monotonic, which is what makes the search provably safe rather than merely plausible.
The displayed price rounds down to the nearest £100, so it never overstates what the structure supports.
It is not a valuation. It is the ceiling implied by one specific funding structure and one specific set of safety assumptions you chose yourself.
Risk analysis
The business side also assesses risk across four dimensions — financial resilience, revenue quality, operational dependency and transaction structure — from rule-based thresholds, deterministically. No model, no scoring engine.
Deliberately not a single 0–100 score. One number invites false precision and hides which thing is actually wrong. Each dimension gets its own verdict and the findings are named individually.
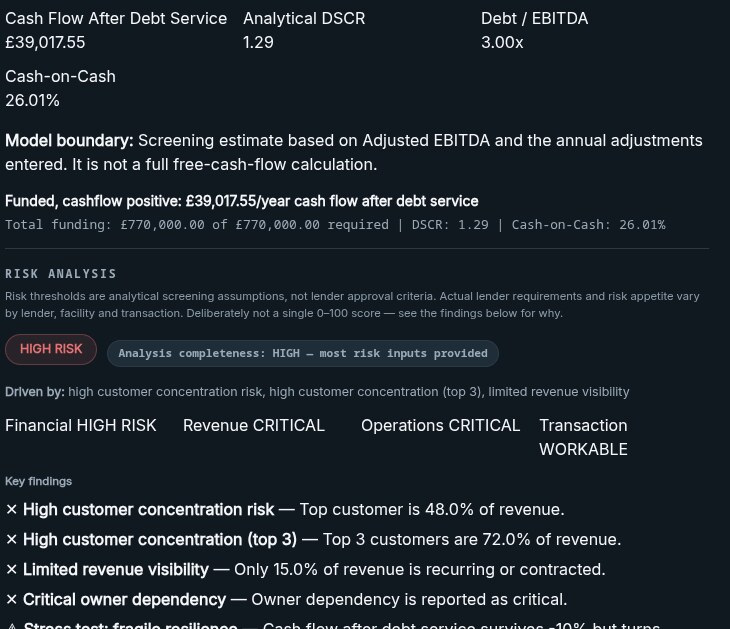
Illustrative sample inputs. The deal is fully funded and cashflow positive at a DSCR of 1.29 — and still comes back HIGH RISK, because nearly half the revenue sits with one customer and the business depends critically on the owner who is leaving.
That example is the whole point of the section. The financing arithmetic and the quality of the thing being financed are different questions, and a tool that only answers the first one will let you buy something you shouldn’t.
What the output means: a set of named, rule-based observations about a deal, from thresholds I chose. What it does not mean: a lender’s view, an underwriting decision, a prediction, or a judgement that any deal is safe. The tool says so on its own results panel.
How the maths is tested
253 automated tests across the calculation engine, all passing. What matters more than the number is what they hold in place:
- Golden cases — full worked deals for BTL, BRRR, HMO and business acquisition, asserted end to end.
- Edge cases — zero and negative denominators, 100% LTV, full-recycle refinances, the boundaries where a naive formula breaks.
- Tax boundaries — SDLT and LTT band edges tested at the exact threshold, with and without the additional-property surcharge.
- Scoring thresholds — the strong/moderate/weak boundaries tested at their strict edges, so “just over the line” and “exactly on it” behave as intended.
- Forward-calculator equivalence — every reverse-solver result is replayed through the real forward calculator and confirmed to satisfy every active constraint, while price-plus-tolerance breaks at least one. That is what makes the solver’s answer checkable rather than trusted.
- Corrupt storage — malformed or tampered saved-deal data never crashes the tool.
What they do not prove, and cannot: that your assumptions are right. The tests prove the engine computes what it claims from the inputs it was given. Rent voids, refurb overruns, a lender’s actual criteria and whether tax rules have changed since are all outside what any test here can tell you.
What the tests caught
Two real defects, described as they actually happened — the two were found in different ways, and the difference matters.
The sign-flip pair, exposed by characterisation tests. Before refactoring the property engine, I captured its existing behaviour in 71 assertions read off the unmodified code, so that “no regression” would be checkable rather than asserted. Those assertions exposed two pre-existing bugs neither I nor the calculator had noticed: a BRRR that fully recycled its capital with positive cashflow reported ROCE of −73.47%, and an HMO losing £195 a month at high LTV reported ROI of +12.65%. Both were real, both had been shipping, and the second is the dangerous one — a losing deal displaying a healthy positive return.
They were then deliberately not fixed in that stage. Both were locked into the test suite under the name KNOWN MODEL CHARACTERISTIC and documented, so the refactor could be proven behaviour-identical rather than quietly changing the maths at the same time. The fix — the N/A semantics described above — came afterwards, as its own decision.
The tolerance bug, found by scratch testing before the suite existed. While building the reverse solver, a single 0.01 tolerance was reused for both currency comparisons and ratio comparisons. On the currency side that is a sensible penny-level epsilon; on a ratio like DSCR it is enormous, and the search would happily settle for a DSCR up to roughly 1% below the target it had been told to hold. It was found by hand-checking the module’s output before the formal tests were written. The fix was two separate scales — one for money, one for ratios — with a comment in the code saying not to reuse one for both, and tests that hold the boundary.
What it is not
- Not financial, tax, legal or lending advice. It is a screening tool. Talk to a broker, an accountant and a solicitor before committing to anything.
- Not a valuation. Neither the property figures nor the reverse solver’s sustainable price is an opinion of market value.
- Not an underwriting model. The DSCR target and every risk threshold are analytical assumptions you set or I chose. No lender has agreed to any of them.
- No AI anywhere in it. Every output is deterministic arithmetic and explicit rules. The same inputs always produce the same answer.
- Only as good as your inputs. It does not know your actual rent, your actual refurb cost, or whether the seller’s figures are honest.
- Some things are deliberately not modelled — income tax and CGT, investor profit-share economics, and interest on deferred consideration are all out of scope rather than approximated badly.
- No track record attached. I am not a landlord with a portfolio and I do not buy property personally. This is a tool I built and use, not evidence of investment performance.
Where it stands
The MVP is complete. It shipped as five stages — property calculations, business acquisition, risk analysis, the reverse solver, and the saved-deal workflow — and there is no Stage 6 queued.
Since then it has been in real-world validation: using it on actual property and business opportunities to find out where it makes me reach for a spreadsheet. That phase started in August 2026 and no formal trial observations have been published yet, so there is no usage evidence here to point at — only the deliberate decision not to build the next thing until real use says what it should be.
That is the honest current state: a finished, working MVP, and a validation phase that has begun but has not yet produced published findings. The next feature will come from a friction point that actually occurred, not from a roadmap written in advance.